
A little-more-than-casual but not-very-wonky statistical look at the current season
Updated Thursday, Aug. 30, at 12:04 p.m.
As opposed to the charts on the League page which look at team-level numbers, the charts below look at how players are performing using distribution plots. These show how far away players (the orange dots) are from the median (the green line within the green box). For each measure there's a plot for the Sox side-by-side with the Cubs, allowing us to compare players on the same team and with players from the other.
With data via fangraphs.com, I've combined violin plots, box-and-whisker plots and swarm charts. Click here to learn more about each plot.
The swarm plot is the orange dots. Each dot represents a player, and would normally be distributed along a straight vertical line - or axis - aligned with the name of their team. But overlapping dots would be hard to see. A swarm plot simply moves them left or right of the center line so you can see each dot.
The olive lines are the box-and-whiskers plot, otherwise known as a box plot. Excluding outliers, this chart divides up all the values into quartiles with the box showing the middle two quartiles. Roughly half of the players should be within this box. The line in the middle of the box is the median. Outliers are anything that fall beyond the "whiskers," or the lines shooting out above and below the box.
Below all that is the violin or what I call a displacement plot. It's the color area where the width represents the number of players that fall along the horizontal axes. The more values at a particular point, the wider the plot is at that point - kind of how rocks in the middle of a stream will displace the water flowing around them. I'm also using the colors of the plot to quickly identify each team (black = White Sox, blue = Cubs).
Many of these plots illustrate why it's important to look at how numbers are distributed instead of just summary stats like mean and median.
As this is being written at the end of April, several charts show the two teams' medians (the line in the middle of the box) very close to each other. Which makes no sense, when you consider their records at the time. But when you look at how values for each player are distributed, you can better understand what's going on.
One team could have players much lower and much higher than the median, while the other could have many players clustered around the median.
These charts may be a bit hard to grasp at first, but once you get them they're very informative. Plus I'll be turning a few of these into animated gifs at the end of the season so we can see how things changed over time.
I'll only be using non-pitchers in this comparison. I thought about excluding the DH as well, but found that to be far too difficult to figure out since anyone could peform as a DH.
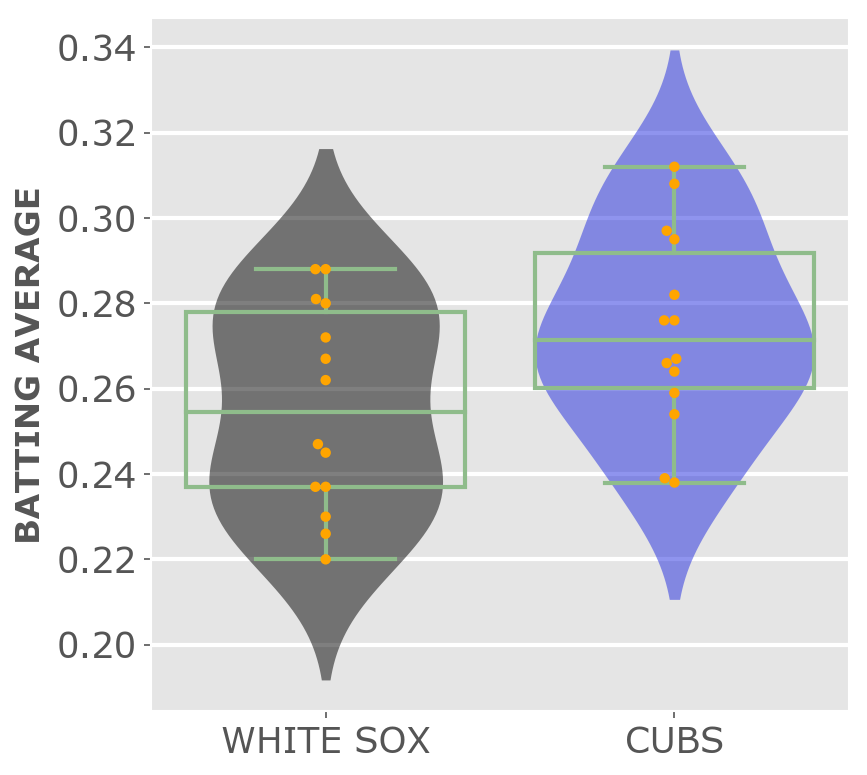
Batting average is the classic measure of a batter's average performance, expressed as a ratio of a batter's safe hits per official times at bat. Not to be confused with plate appearances, which is the total number of times a player has been up to bat and includes things like walks. A high number is better.
Honestly, anyone who has ever confused the two probably should not have anything to do with baseball. (Full disclosure: I have totally confused the two.)
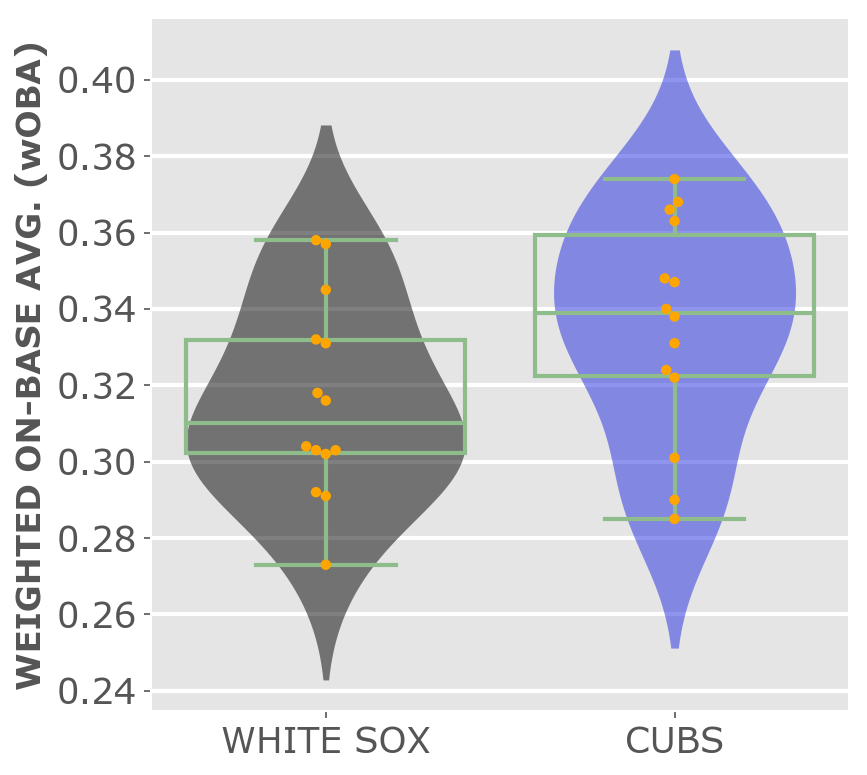
Weighted On-Base Average combines batting average, on-base percentage, and slugging percentage, "weighting each of them in proportion to their actual run value" according to fangraphs.com. A high number is better.
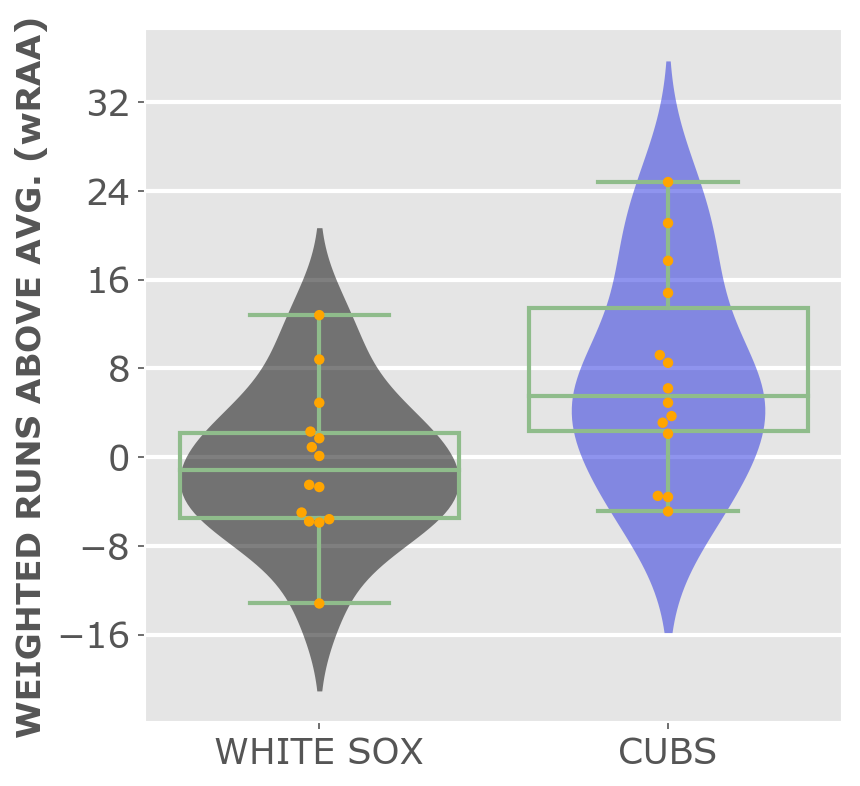
Measures the number of runs a player contributes offensively to their team compared to an average player. A high number is better.
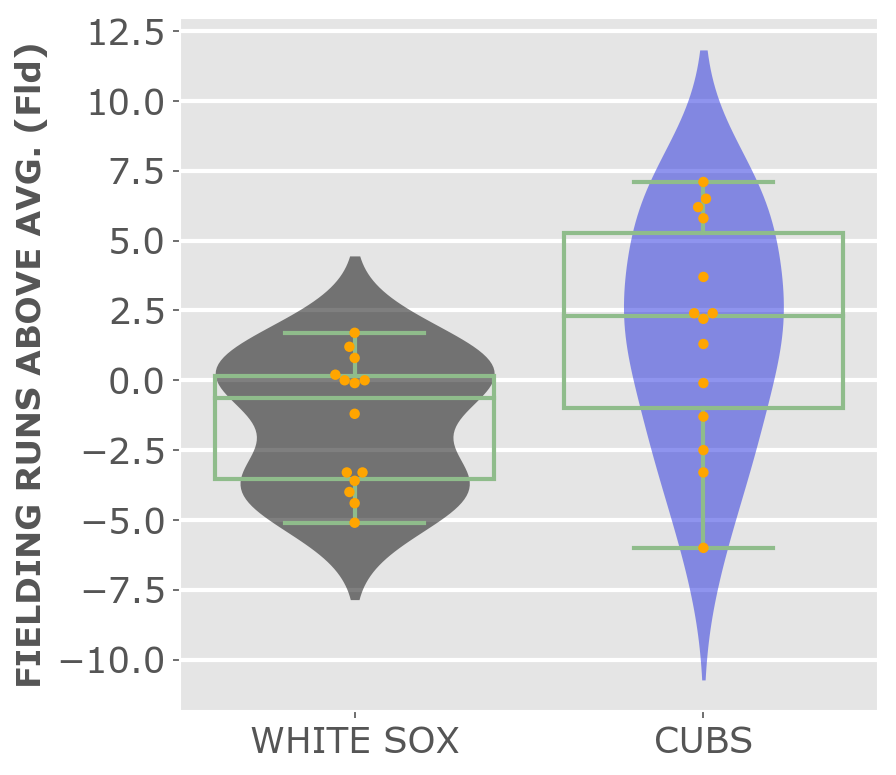
Measures defensive value of a player based on how many runs they save versus an average replacement player. A higher number is better.
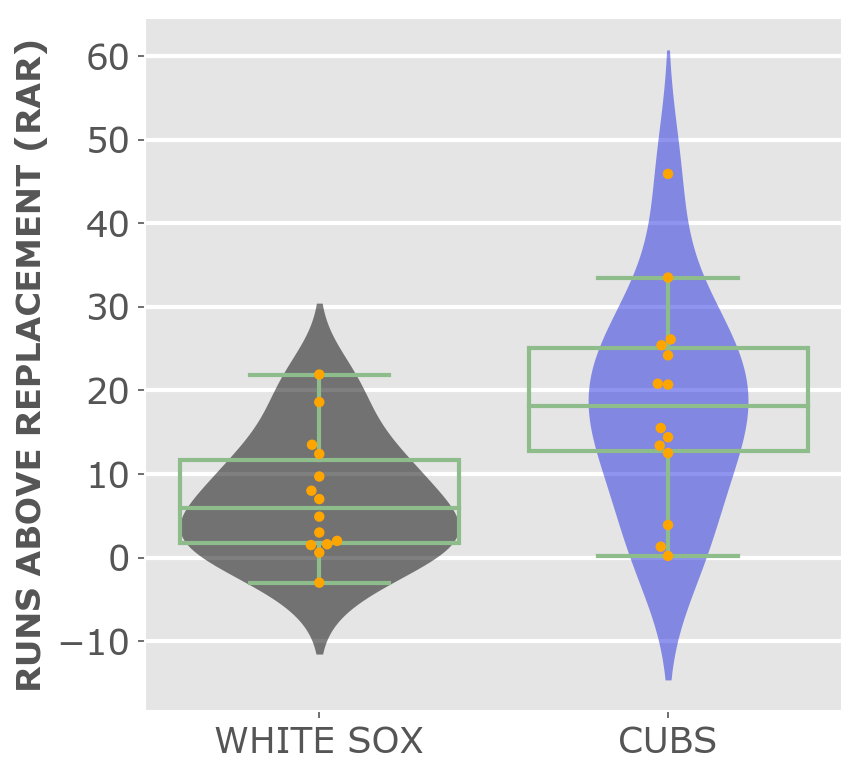
Number of runs a player contributes, offensively and defensively, versus an average replacement player. A high number is better.
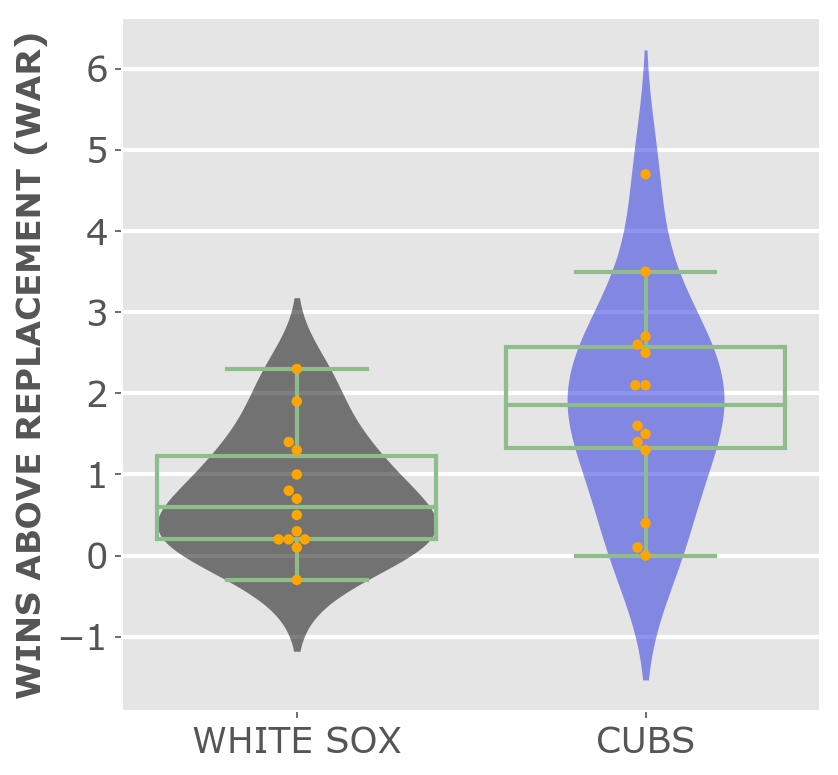
Fangraphs describes Wins Above Replacement or WAR as the average number of wins a player is worth compared to what you'd get from an average replacement player. The higher the WAR number, the more valuable a player is.
JUMP TO TOP | POSITION PLAYERS
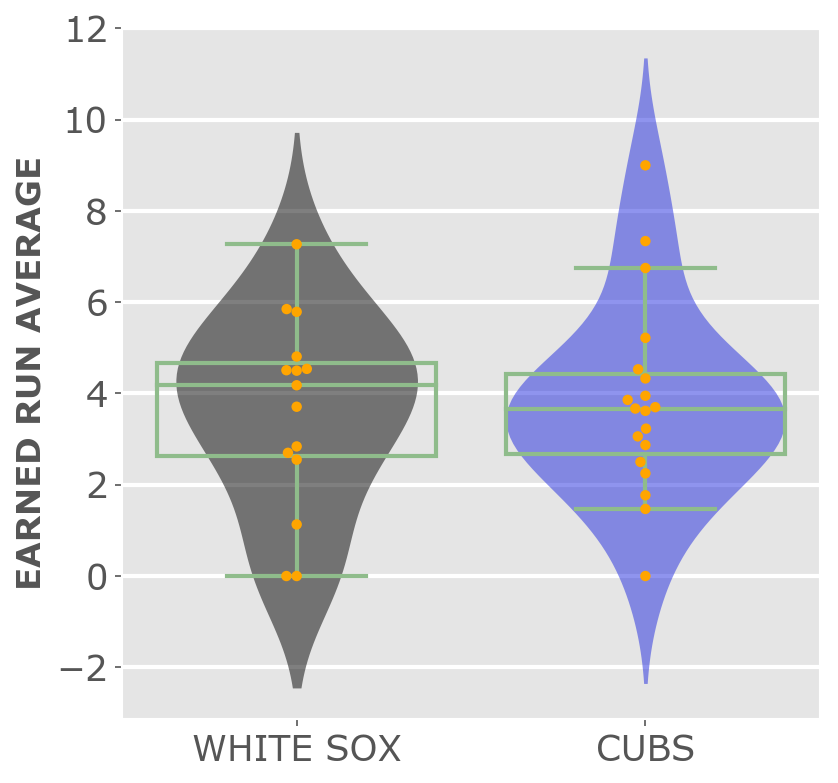
Average number of earned runs scored against the pitcher per every nine innings pitched. A lower number is better.
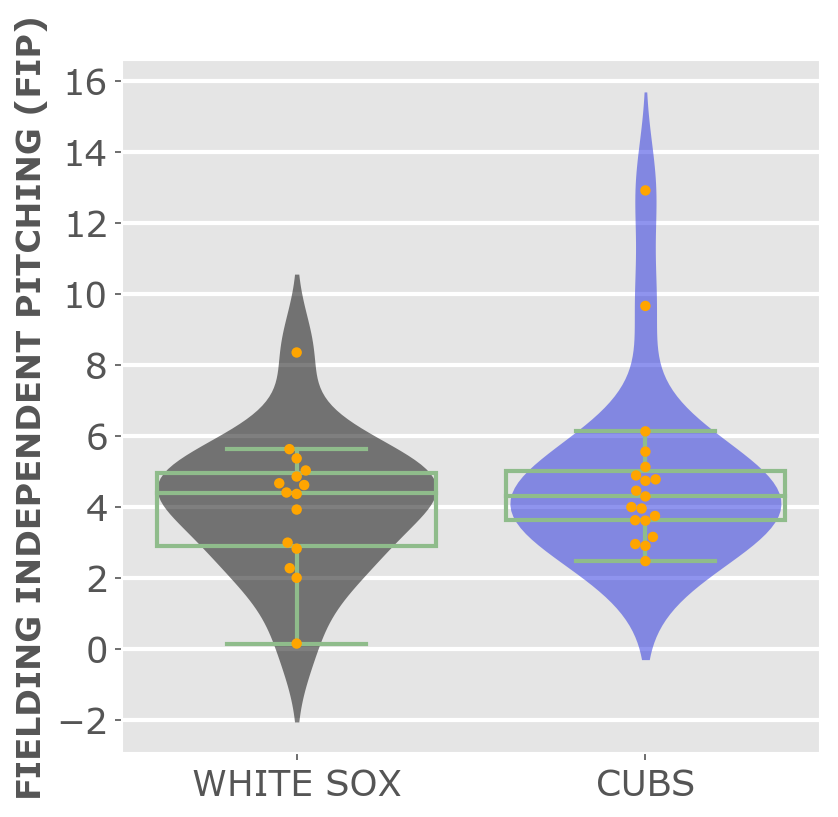
FIP or Fielding Independent Pitching tries to show a pitcher's ERA correcting for the performance of the fielding around them. According to fangraphs, FIP looks at "their strikeouts, walks, hit batters, and home runs while assuming average luck on balls in play." A lower number is better.
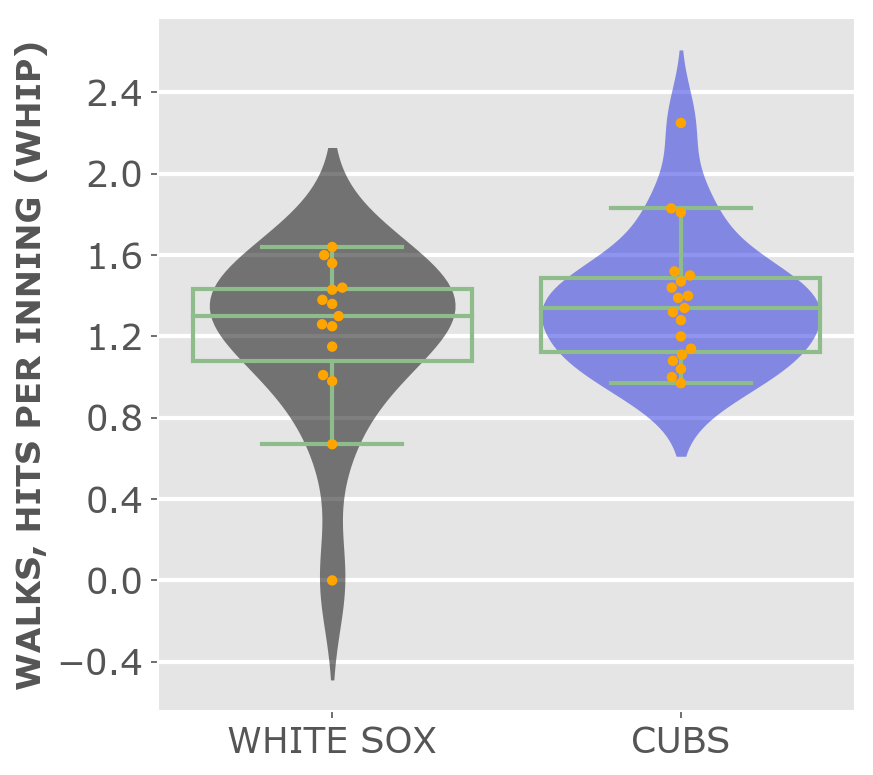
Measures how many baserunners a pitcher allows per inning. A lower number is better.
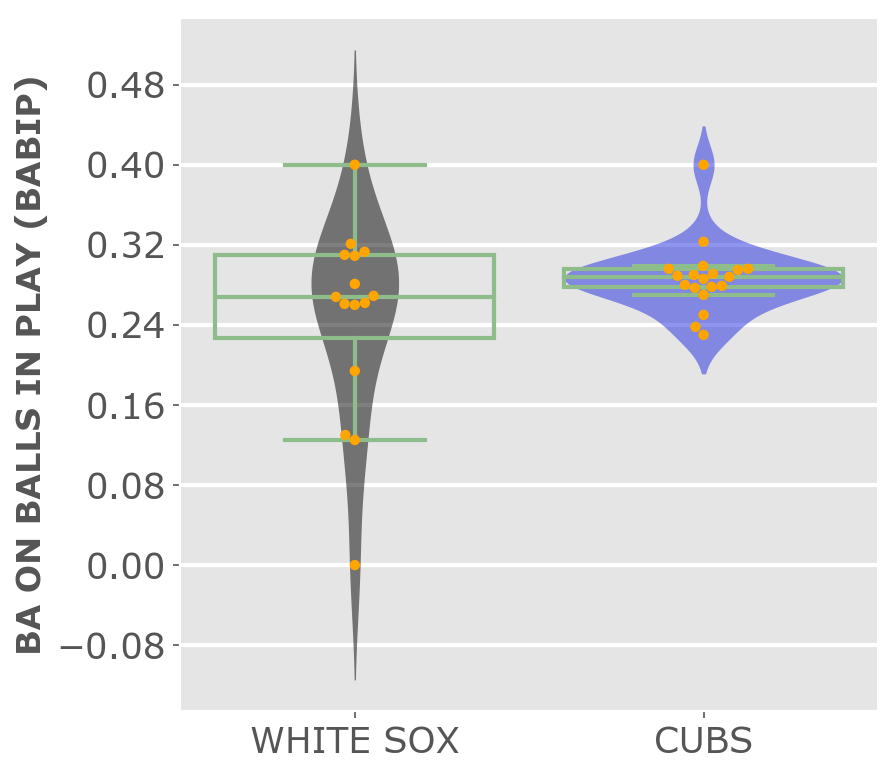
Batting Average on Balls In Play (BABIP) measures average batting average allowed based on how often a ball in play goes for a hit. Balls in play don't include home runs. So if the pitcher is giving up a lot of hits their defense can't handle, or if you have a third baseman who doesn't make those tougher plays, the BABIP is higher. A lower number is better.
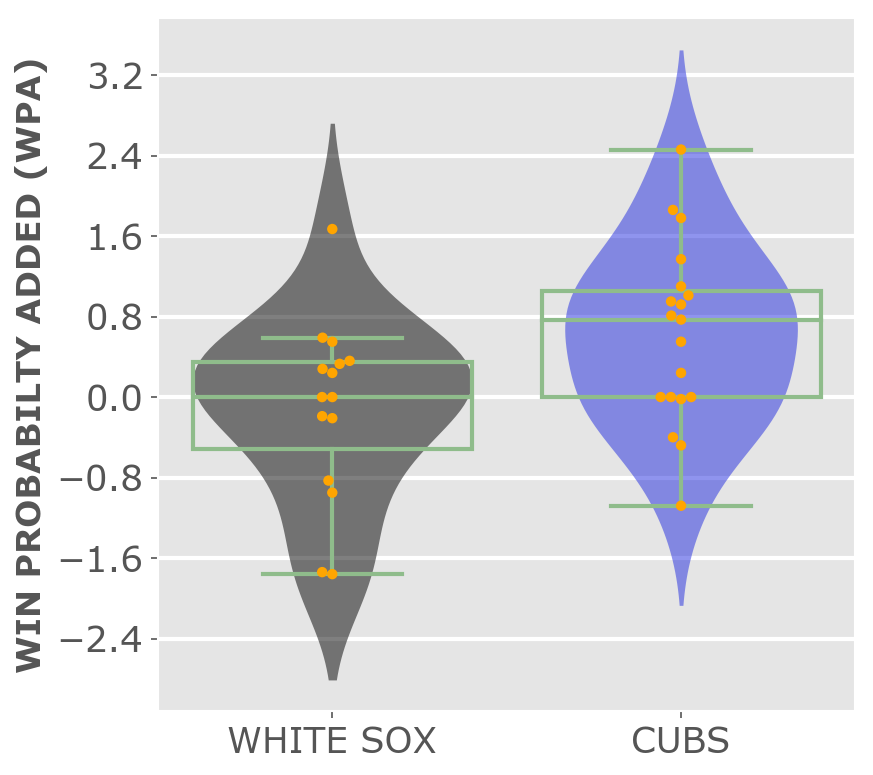
Tries to show, using percentages, how much a player contibutes to a win. Higher is better.
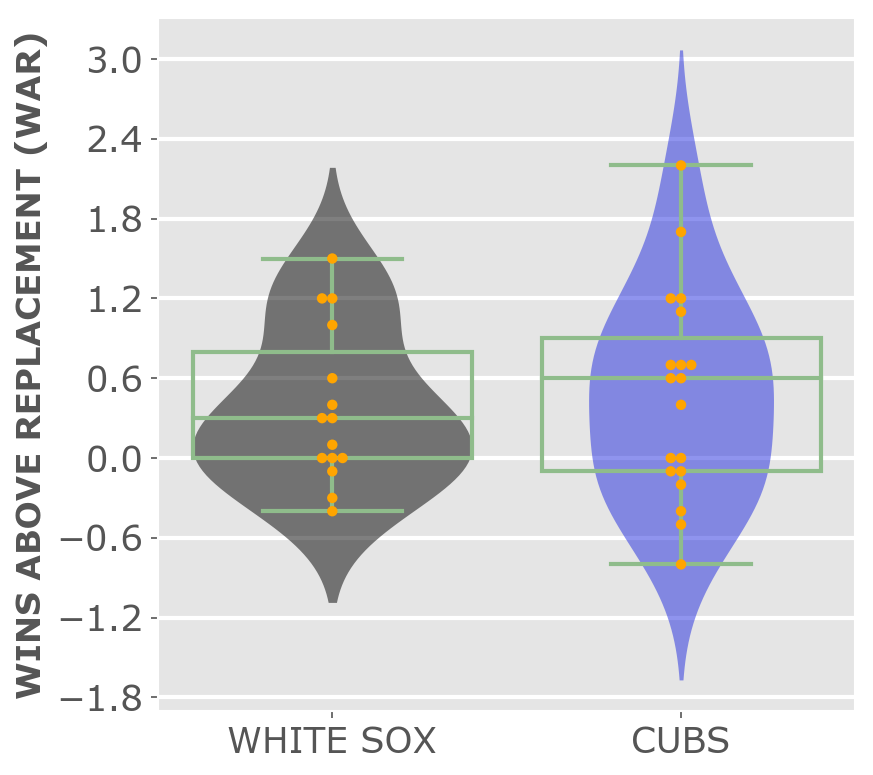
Number of runs a player contributes, offensively and defensively, versus an average replacement player. A high number is better.

Fangraphs describes Wins Above Replacement or WAR as the average number of wins a player is worth compared to what you'd get from an average replacement player. The higher the WAR number, the more valuable a player is. A higher number is better.
JUMP TO TOP
I'm following the baseball season by creating this app using python/flask, the Seaborn charting library and the pybaseball package by James LeDoux. My code can be found here. | Cool little timestamp function courtesy of Mike Stucka of the Palm Beach Post. Thanks Mike! | Hat tip to Patrick Judge for the timely help on plate appearances.
Tim Broderick | Daily Herald News Art | Github
Subscribe | Terms of Service | Privacy Policy | Copyright © 2018 Paddock Publications, Inc.