
A little-more-than-casual but not-very-wonky statistical look at the current season
Updated Thursday, Aug. 30, at 12:04 p.m.
JUMP TO TOP | VISUALIZATIONS
Pybaseball gathers these from Baseball-reference.com. This site is updated around 8 a.m., 10 a.m. and noon each day, but information is not always updated by the time this page is so it may be slightly out of date.
| Team | Wins | Loses | W-L % | GB |
|---|---|---|---|---|
| Red Sox | 92 | 42 | .687 | -- |
| Yankees | 84 | 49 | .632 | 7.5 |
| Rays | 71 | 62 | .534 | 20.5 |
| Blue Jays | 60 | 73 | .451 | 31.5 |
| Orioles | 40 | 94 | .299 | 52.0 |
| Team | Wins | Loses | W-L % | GB |
|---|---|---|---|---|
| Indians | 75 | 57 | .568 | -- |
| Twins | 62 | 70 | .470 | 13.0 |
| White Sox | 53 | 80 | .398 | 22.5 |
| Tigers | 53 | 80 | .398 | 22.5 |
| Royals | 42 | 91 | .316 | 33.5 |
| Team | Wins | Loses | W-L % | GB |
|---|---|---|---|---|
| Astros | 82 | 51 | .617 | -- |
| Athletics | 80 | 54 | .597 | 2.5 |
| Mariners | 74 | 59 | .556 | 8.0 |
| Angels | 64 | 69 | .481 | 18.0 |
| Rangers | 58 | 76 | .433 | 24.5 |
| Team | Wins | Loses | W-L % | GB |
|---|---|---|---|---|
| Braves | 74 | 58 | .561 | -- |
| Phillies | 71 | 62 | .534 | 3.5 |
| Nationals | 67 | 67 | .500 | 8.0 |
| Mets | 59 | 74 | .444 | 15.5 |
| Marlins | 53 | 81 | .396 | 22.0 |
| Team | Wins | Loses | W-L % | GB |
|---|---|---|---|---|
| Cubs | 78 | 54 | .591 | -- |
| Cardinals | 74 | 59 | .556 | 4.5 |
| Brewers | 74 | 60 | .552 | 5.0 |
| Pirates | 65 | 68 | .489 | 13.5 |
| Reds | 57 | 76 | .429 | 21.5 |
| Team | Wins | Loses | W-L % | GB |
|---|---|---|---|---|
| Diamondbacks | 73 | 60 | .549 | -- |
| Rockies | 72 | 60 | .545 | 0.5 |
| Dodgers | 72 | 61 | .541 | 1.0 |
| Giants | 67 | 68 | .496 | 7.0 |
| Padres | 52 | 83 | .385 | 22.0 |
Pybaseball gets these statistics from fangraphs.com. I'm using Seaborn, a Python visualization library, to create the charts. Seaborn is inspired by ggplot2 in R.
As far as how I decide what and how I chart, I'm using the highly sophisticated method of "Well that sounds important, I wonder what it would look like if I chart it with this other thing that sounds important." A high bar indeed.
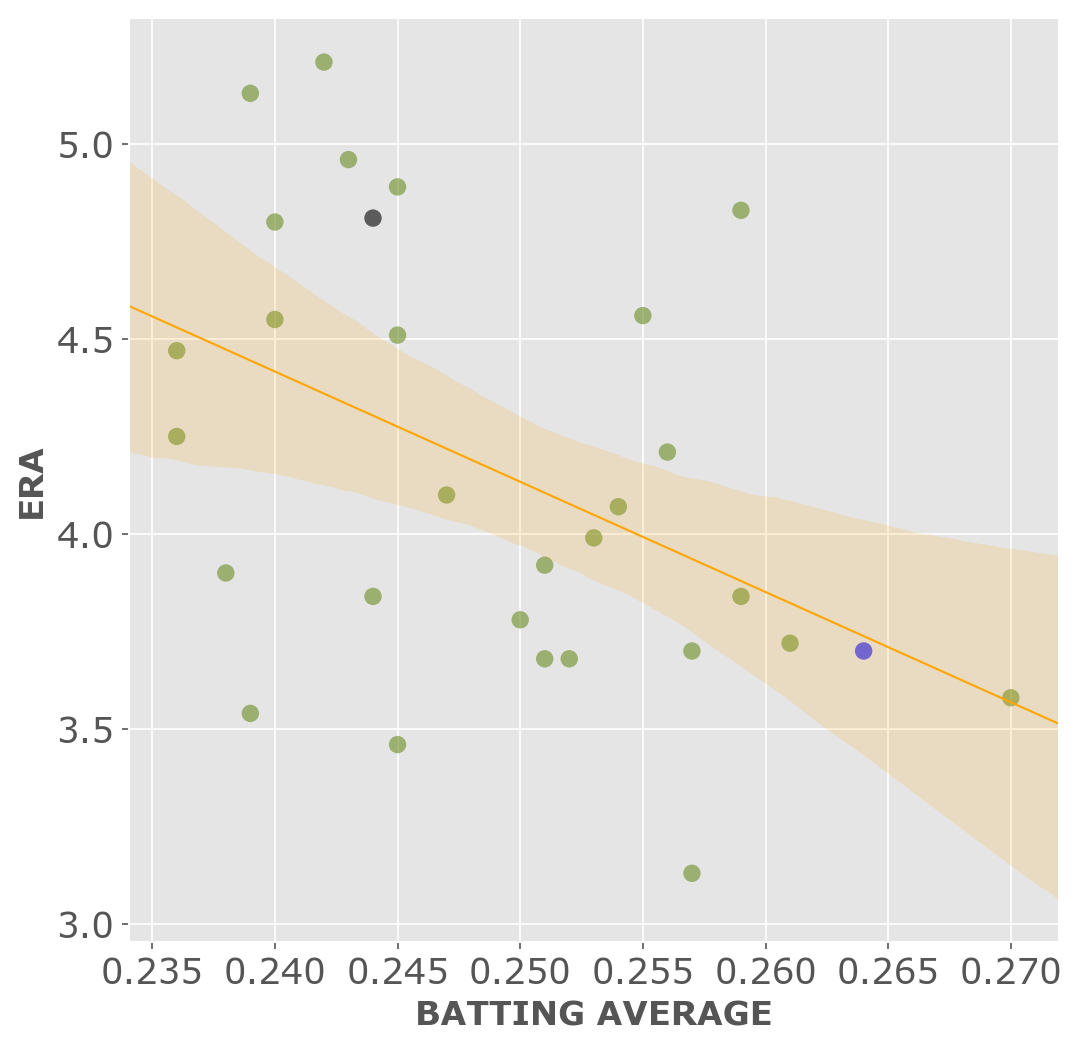
The classic statistics - obviously a high batting average and a low ERA should equal more wins.
I don't expect there to be much of a correlation between the two stats, but it's handy to have them accessible in one chart like this.
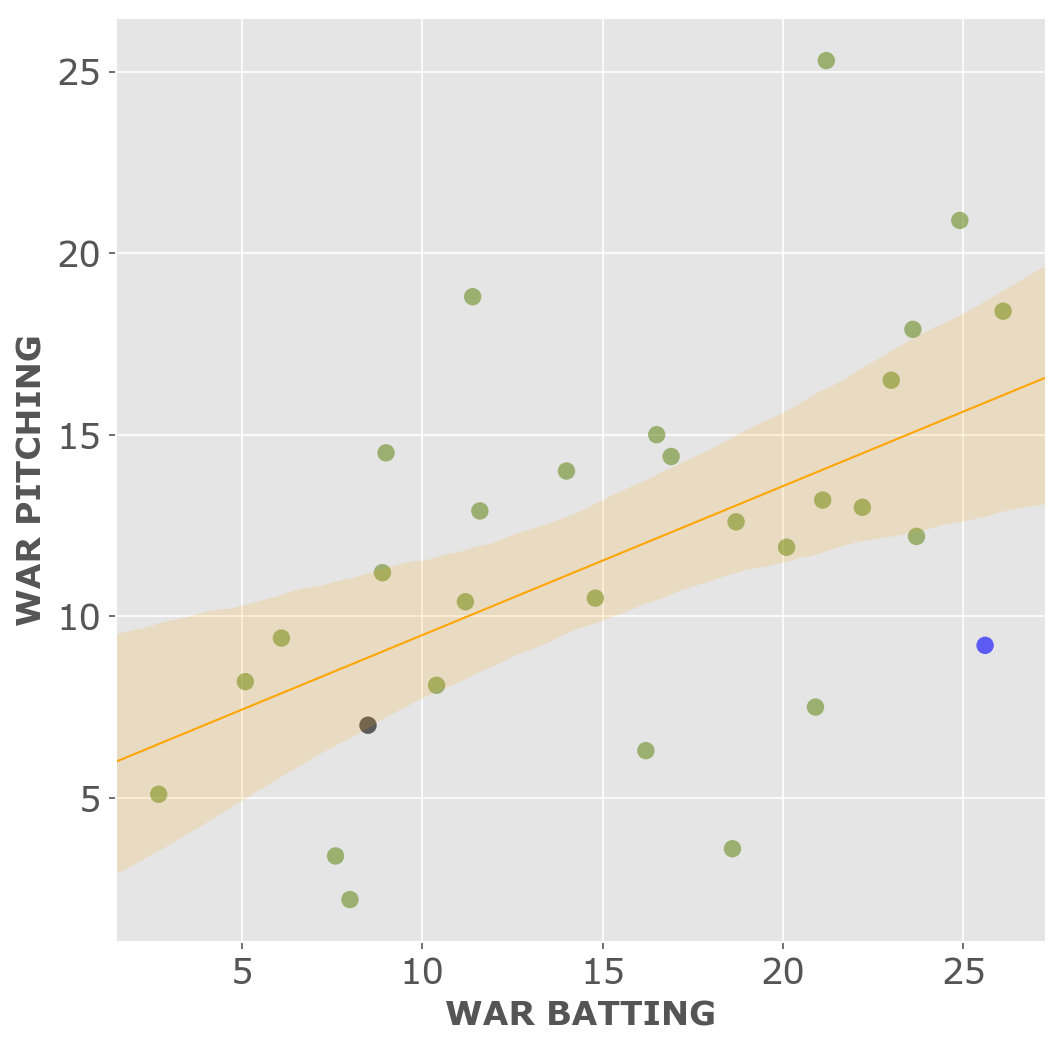
Fangraphs describes Wins Above Replacement or WAR as the average number of wins a player is worth compared to what you'd get from an average replacement player. The higher the WAR number, the more valuable a player is. The team number is the sum of all WAR stats for each individual player. That means, like with mean (or average) a player with a very high or very low WAR value could skew the total some. Check out the distribution plots on the h2h page for more.
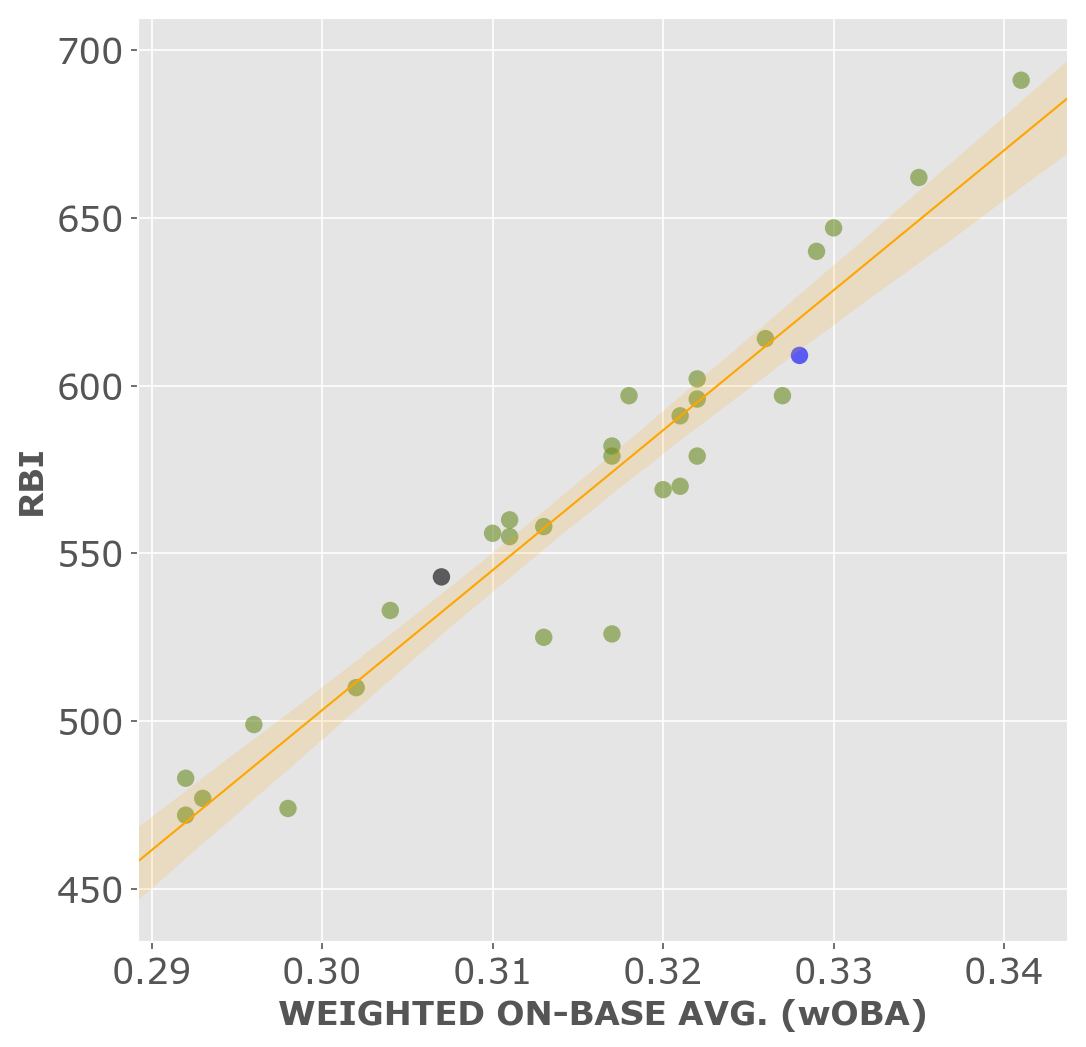
Weighted On-Base Average combines batting average, on-base percentage, and slugging percentage, "weighting each of them in proportion to their actual run value" according to fangraphs.com.
So these two measures should give us a pretty good idea of offensive production, if I think if it in terms of "get 'em on, get 'em over, get 'em in."
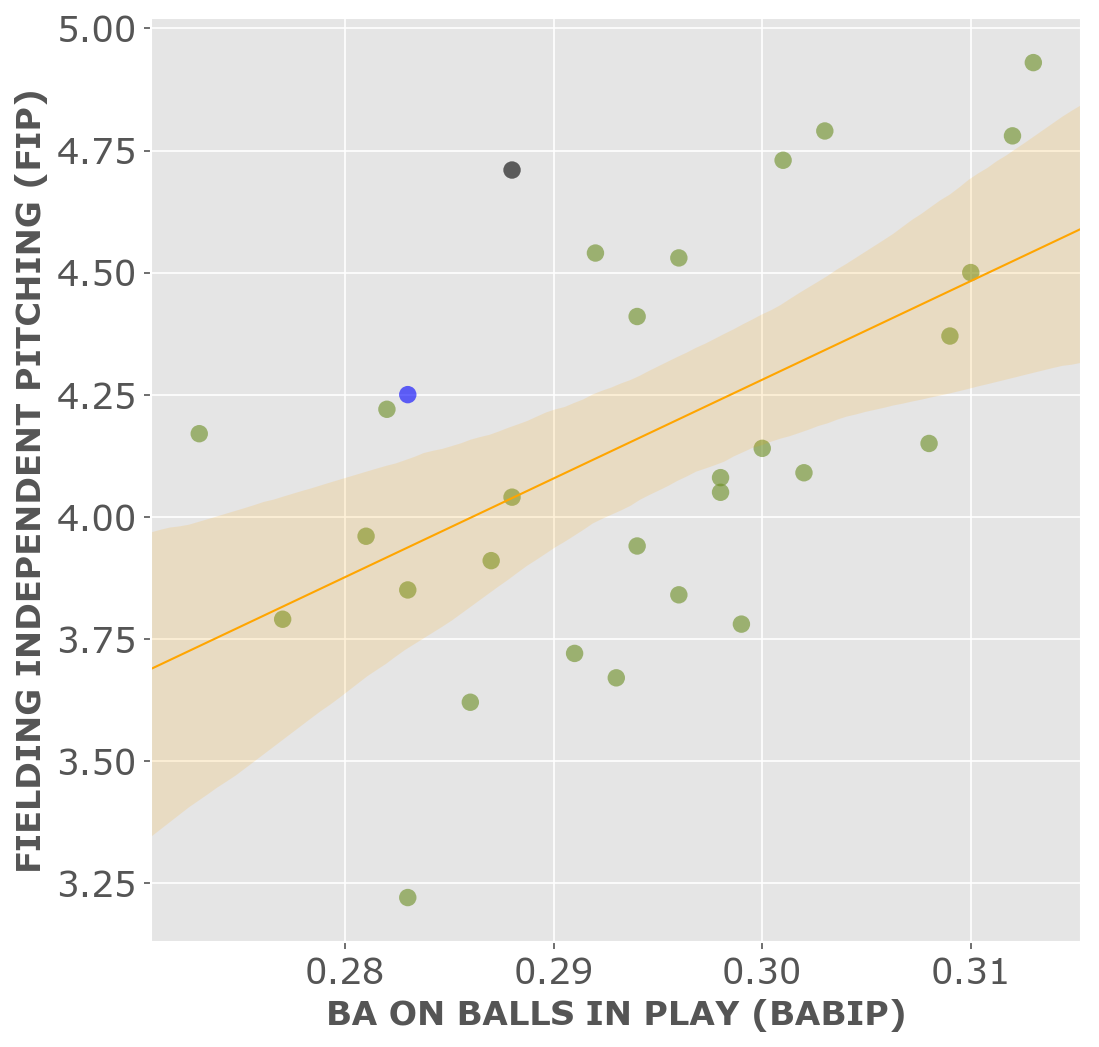
These two stats are pretty new to me.
Batting Average on Balls In Play (BABIP) measures average batting average allowed based on how often a ball in play goes for a hit. Balls in play don't include home runs. So if the pitcher is giving up a lot of hits their defense can't handle, or if you have a third baseman who doesn't make those tougher plays, the BABIP is higher.
FIP or Fielding Independent Pitching tries to show a pitcher's ERA correcting for the performance of the fielding around them. According to fangraphs, FIP looks at "their strikeouts, walks, hit batters, and home runs while assuming average luck on balls in play."
With both of these measures, the lower the better. That should be a challenge given expected home run production this season.
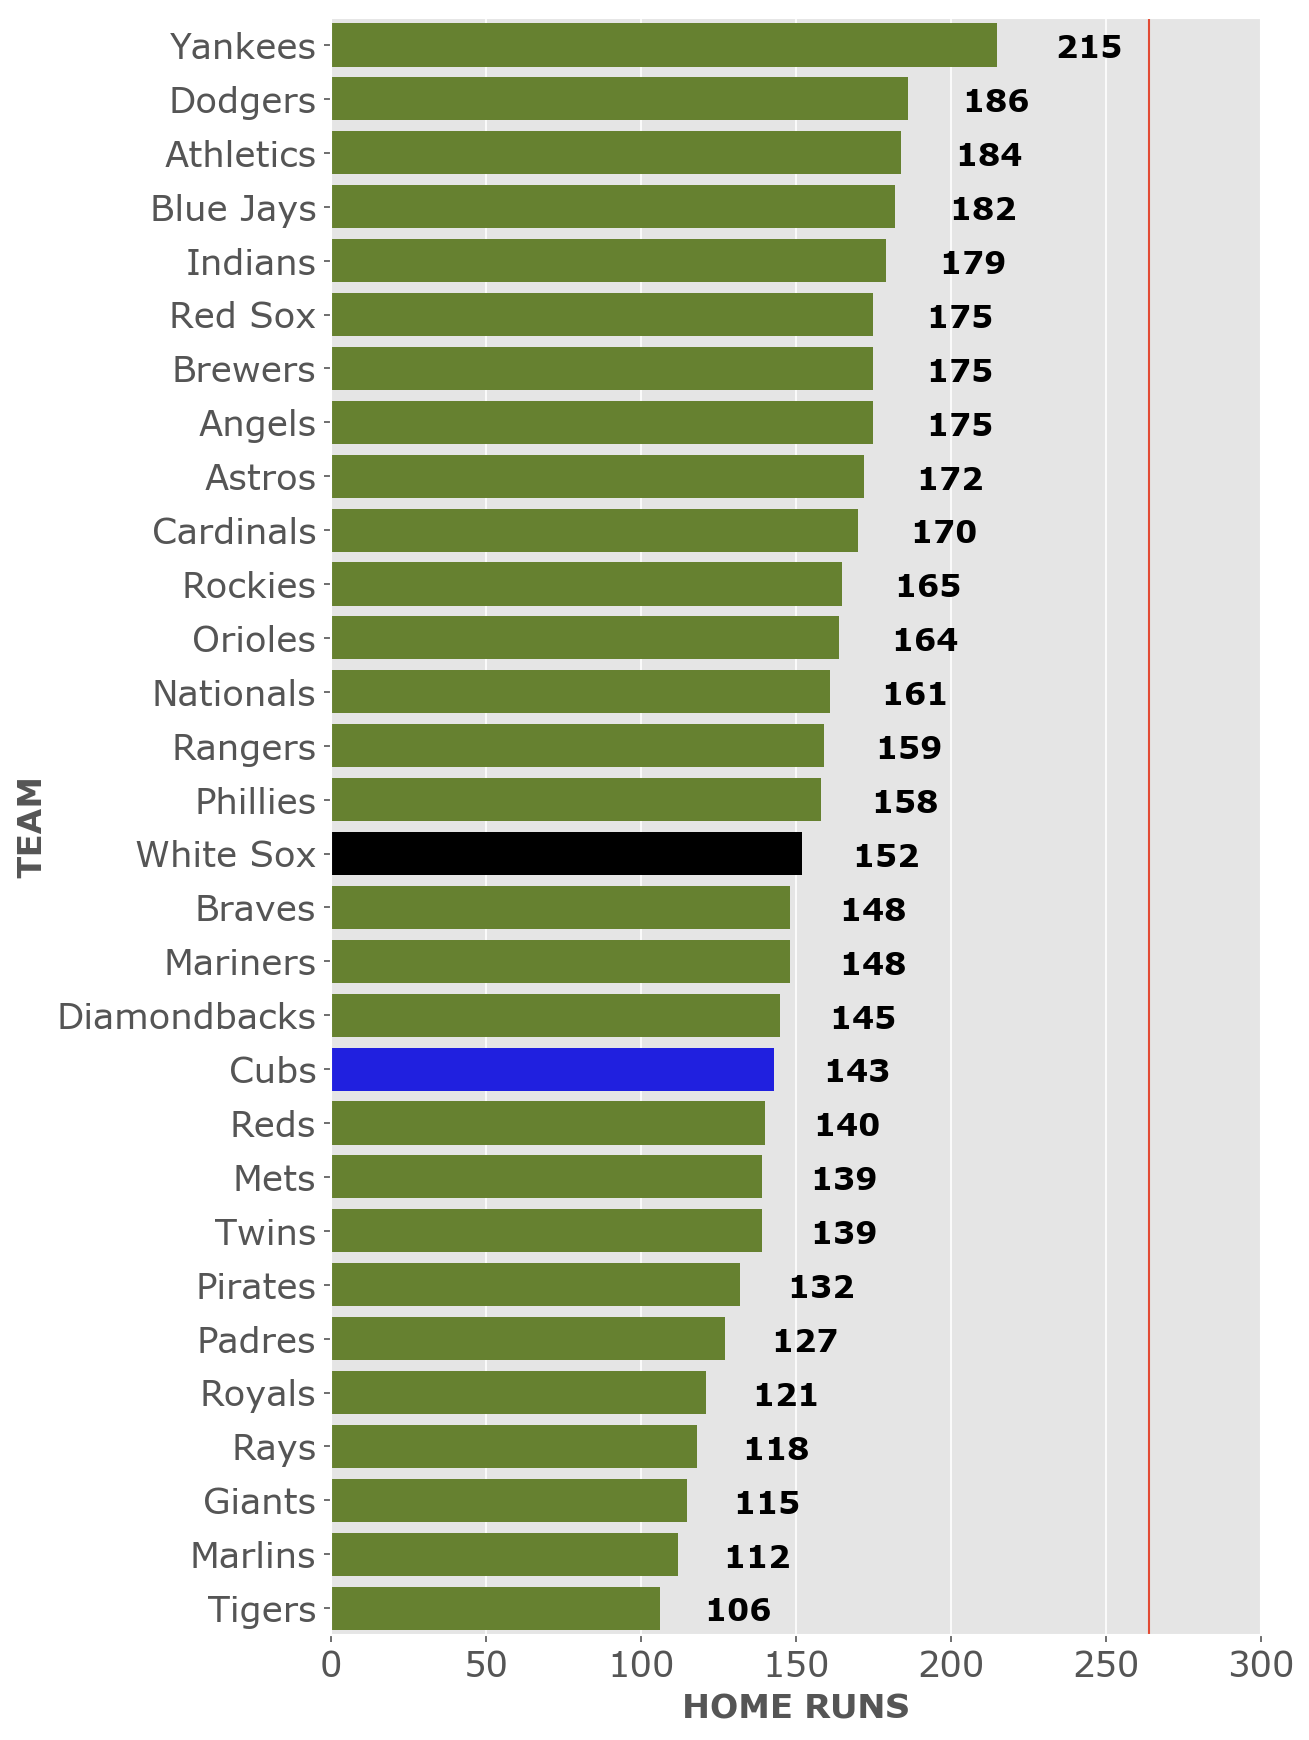
Reports suggest the single-season team home run record may be broken this year so let's track that.
The vertical red line indicates the current record of 264 by the 1997 Seattle Mariners.
JUMP TO TOP
I'm following the baseball season by creating this app using python/flask, the Seaborn charting library and the pybaseball package by James LeDoux. My code can be found here. | Cool little timestamp function courtesy of Mike Stucka of the Palm Beach Post. Thanks Mike! | Hat tip to Patrick Judge for the timely help on plate appearances.
Tim Broderick | Daily Herald News Art | Github
Subscribe | Terms of Service | Privacy Policy | Copyright © 2018 Paddock Publications, Inc.